
- Click Reports in the sidebar (under Insights) and click Chart Reports. The page lists chart reports in groups: Finance Reports, Customer Reports, Vehicle Reports, Invoice & Quote Reports, Items & Stock Reports, Appointments Reports, Operations Reports, Purchase & Warehouse Reports, Online Shop / POS Reports and Staff Reports. Each card says which charts it holds.
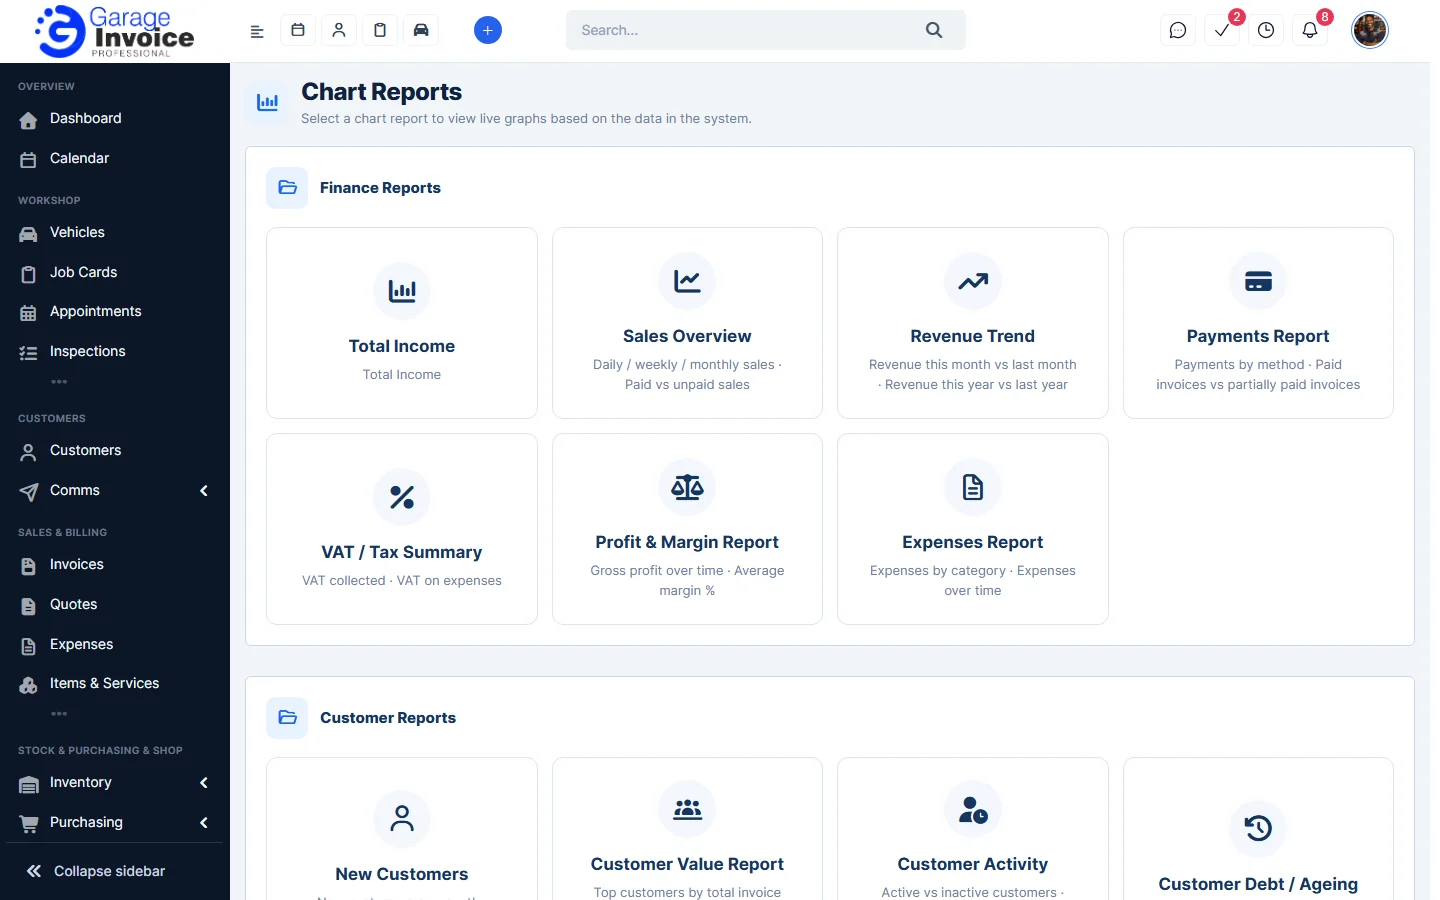
- Click a card, for example Sales Overview. The report opens with its charts, here daily, weekly and monthly sales, paid against unpaid sales, sales with and without VAT and average invoice value.
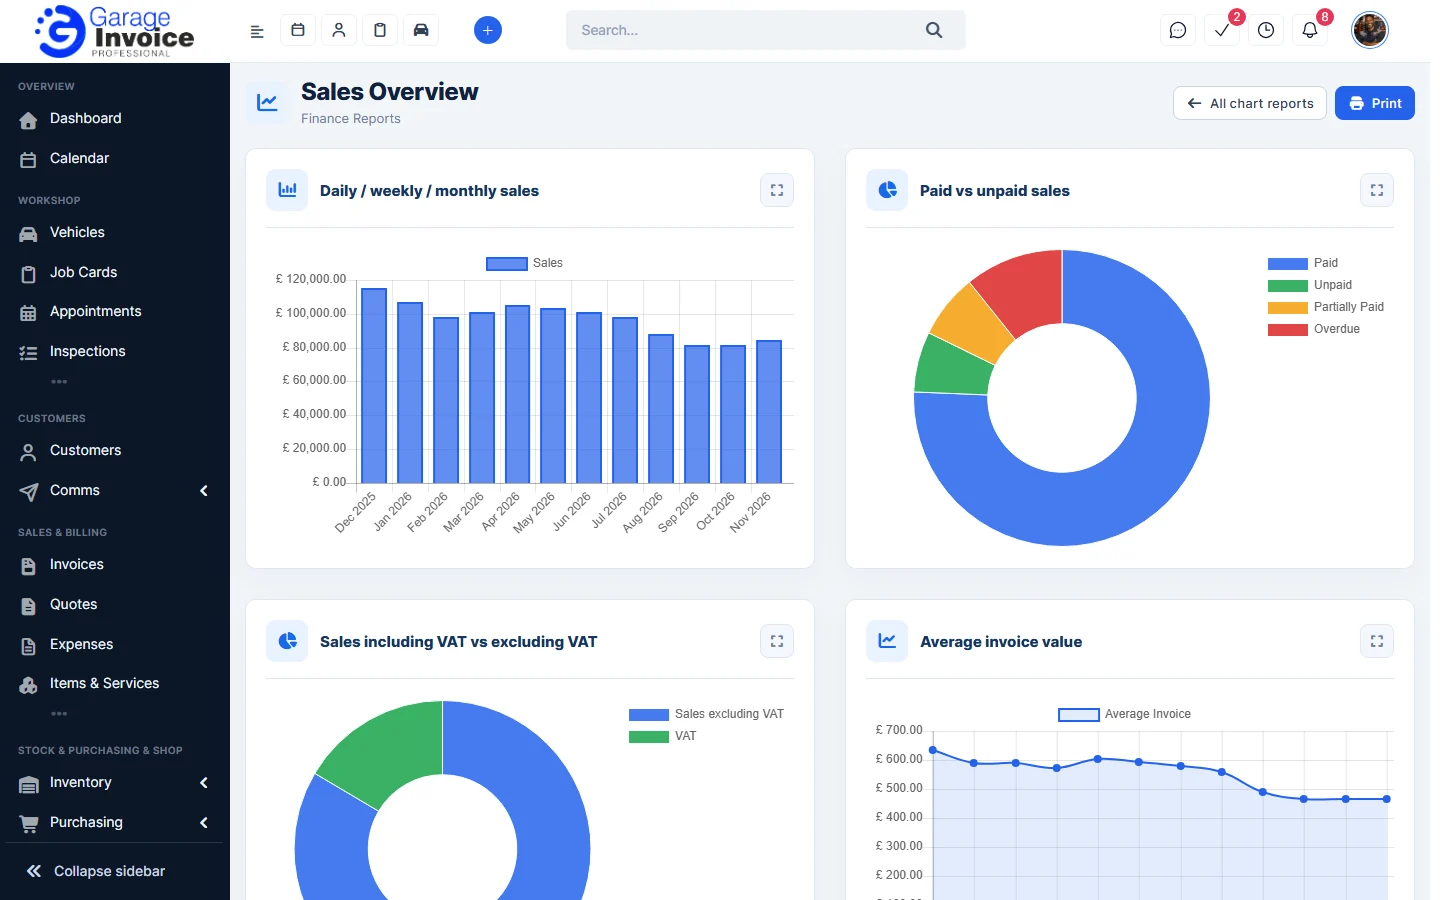
- Click All chart reports at the top right to go back to the list, or Print to print the page.
Tip: for figures you can filter and export, use the table reports such as Sales Report: Invoices or Profit & Loss.
See also: Reports Overview
Feature Garage reports: see what it does and how it fits your workshop.