
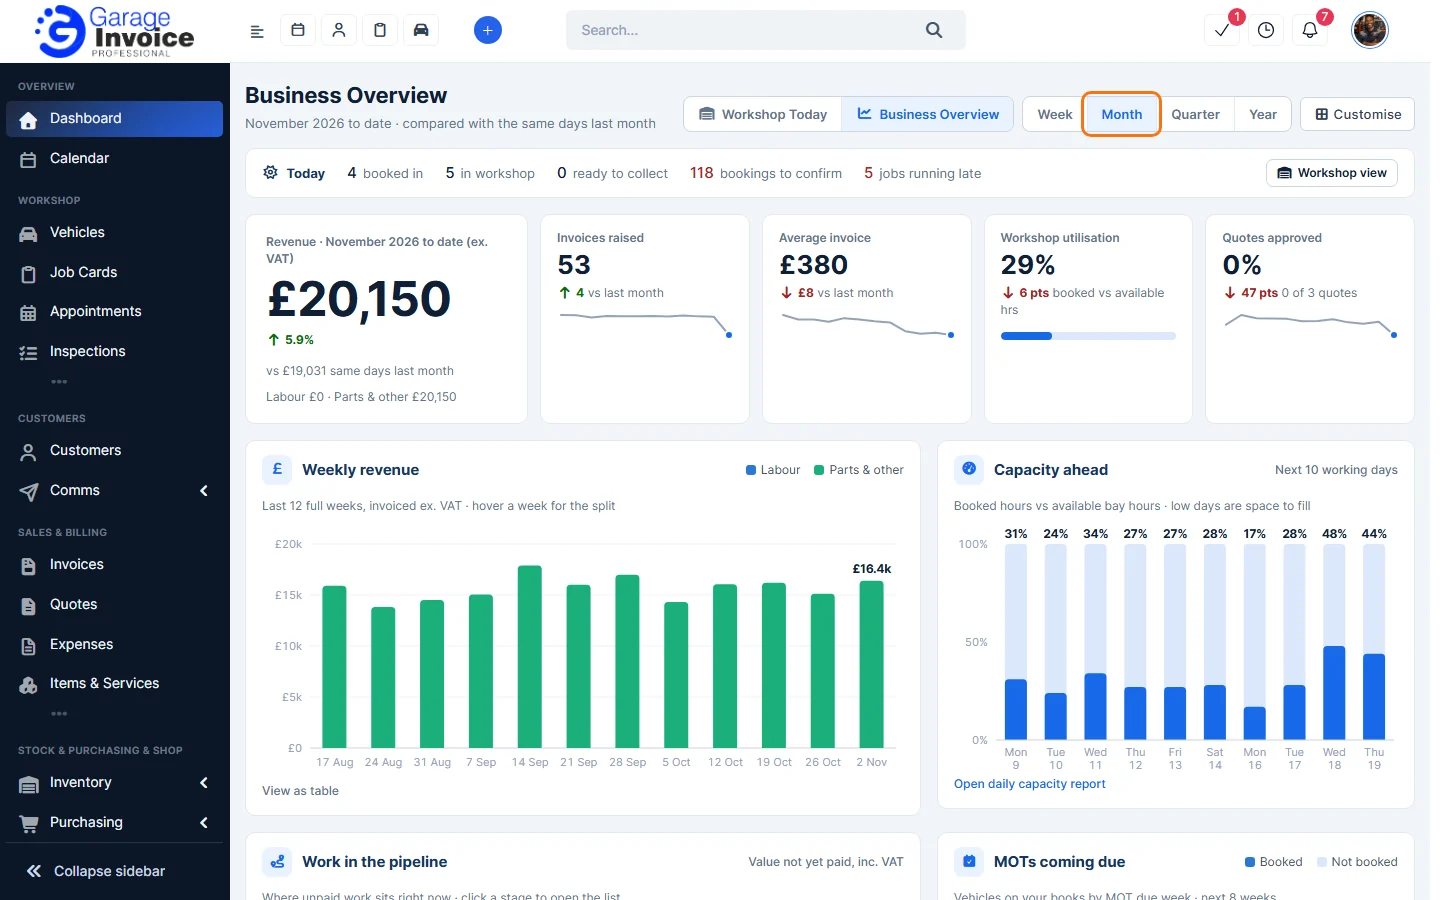
Business Overview shows how your garage is performing. To open it, click Business Overview in the top right corner of the Dashboard.
Choose the period
Use the Week, Month, Quarter and Year buttons to change the period. The figures compare the period to date with the same days in the previous period.
The strip under the title gives a one-line summary of today. Click Workshop view to jump to Workshop Today.
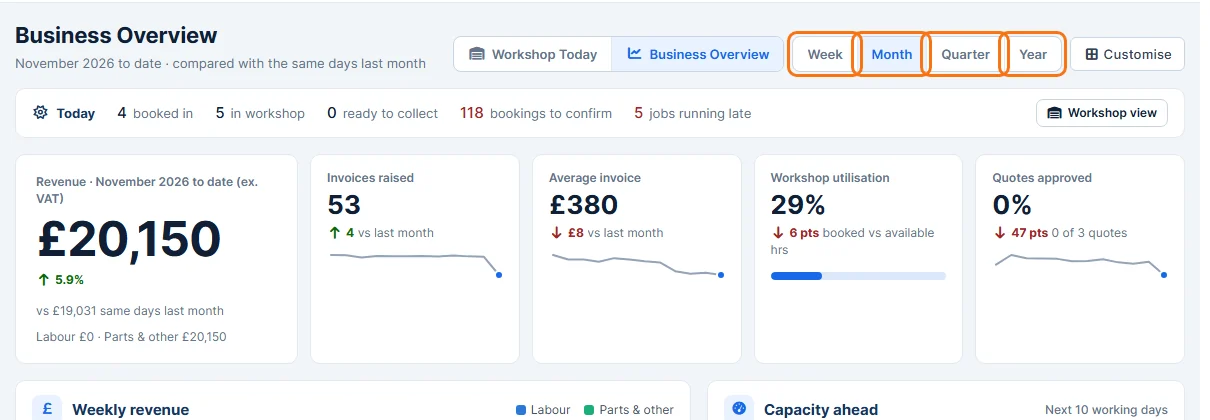
Headline figures
Revenue for the period (excluding VAT, split into labour and parts & other), invoices raised, average invoice, workshop utilisation and the share of quotes approved.
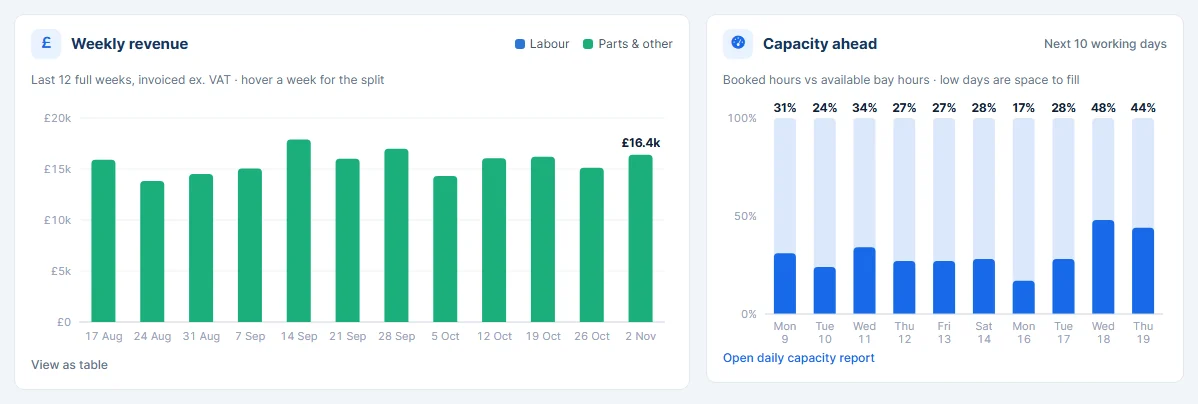
Weekly revenue and Capacity ahead
- Weekly revenue shows invoiced revenue for the last 12 full weeks, split into labour and parts & other. Hover over a week to see the split, or click View as table.
- Capacity ahead compares booked bay hours with available hours for the next 10 working days, so you can see which days have space to fill.
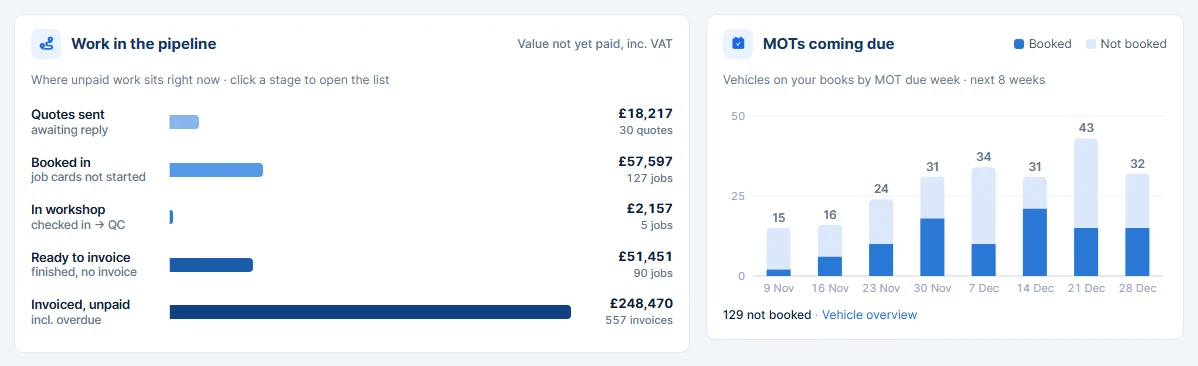
Work in the pipeline and MOTs coming due
- Work in the pipeline shows the value of work that is not paid yet at each stage: quotes sent, booked in, in the workshop, ready to invoice and invoiced but unpaid. Click a stage to open the list.
- MOTs coming due shows how many vehicles have an MOT due each week for the next 8 weeks, and how many of them are booked.
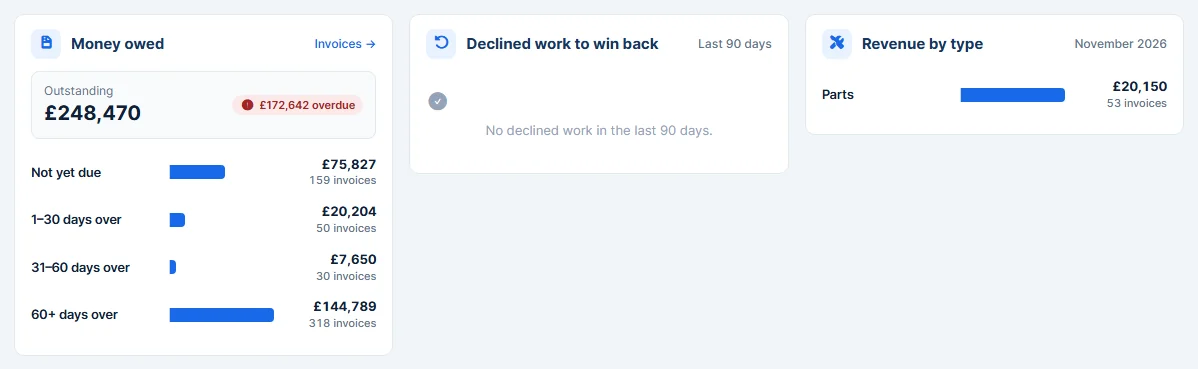
Money owed, Declined work and Revenue by type
- Money owed shows outstanding invoices grouped by how long they are overdue.
- Declined work to win back lists work your customers declined in the last 90 days, so you can follow it up.
- Revenue by type shows invoiced revenue for the period by line type, such as labour and parts.
You can hide, move and resize any of these widgets, or add others. See Show, Hide and Add Dashboard Widgets.